Setting OpenTelemetry to Send Metrics and Traces to Grafana Cloud
Observability is essential for the understanding how your system behaves and for ensuring reliable performance and a solid user experience. As systems grow and evolve there is the need for consistent, vendor-neutral observability tooling, especially when switching between different observability platform providers. Cost is often a key concern as your usage increases, what seemed like an affordable package when you started with low user volumes can quickly become expensive as usave scales up.
The OpenTelemetry (a.k.a OTel) project provides a standard set of protocols and tools for collecting telemetry data - metrics, logs and traces - and exporting it to one of the many observability platforms such as Grafana Labs, Elastic, Datadog and New Relic. You can collect telemetry in a consistent way across your platform and easily reconfigure exporters as your environment or providers change.
In this post, I'll walk through a lightweight Node.js set up using zero-code auto instrumentation, enabling telemetry collection via environment variables. We'll route the collected data to Grafana Cloud via Alloy, Grafana's OpenTelemetry-compatible collector.
Create a basic API
Let's initialise a Node.js package for our basic API we'll create. Ensure you have Node.js installed locally and then initialise a project.
mkdir basic-api
cd basic-api
npm init -y
Create the index.js file which gives us a basic JSON over HTTP API.
// index.js
const http = require("http");
const server = http.createServer((request, response) => {
  response.writeHead(200, { "Content-Type": "application/json" });
  response.end(JSON.stringify({ message: "hello" }));
});

server.listen(3000, () => {
  console.log(`Listening on port 3000`);
});
Start up the API locally.
node index.jsAnd test the API, e.g.
❯ curl http://localhost:3000/
{"message":"hello"}⏎
We now have a basic API which we can instrument with OpenTelemetry to gather metrics and traces.
OTel auto instrumentation
Using OTel auto instrumentation documentation, we can use environment variables to inject instrumentation without adding any code to our API.
We'll need the OTel packages installed.
npm install --save @opentelemetry/api
npm install --save @opentelemetry/auto-instrumentations-node
We'll then set environment variables to describe how we would like to instrument this API. We
can start with trace telemetry going to the console using the console exporter.
This gives a quick visual on the data that is sent. We also inject the auto
instrumentation via a require argument on the node process.
The instrumentation needs to be done before modules are loaded, e.g. before we call
require('http'), hence why adding it as an argument of the node process is the way to go.
Start up the API again with the appropriate environment variables set along with this "require" argument.
OTEL_TRACES_EXPORTER="console" \
OTEL_SERVICE_NAME="basic-api"  \
  node --require @opentelemetry/auto-instrumentations-node/register index.js
When we hit the API again, we should start seeing trace information logged to the console of the API service, e.g.
{
  "resource": {
    "attributes": {
      "service.name": "basic-api",
      "telemetry.sdk.language": "nodejs",
      "telemetry.sdk.name": "opentelemetry",
      "telemetry.sdk.version": "1.25.1"
    }
  },
  "traceId": "50816433d8d5b682f253b4f45bd846e2",
  "parentId": undefined,
  "traceState": undefined,
  "name": "GET",
  "id": "80566118c92a9907",
  "kind": 1,
  "timestamp": 1724317279294000,
  "duration": 3881.291,
  "attributes": {
    "http.url": "http://localhost:3000/hello",
    "http.host": "localhost:3000",
    "net.host.name": "localhost",
    "http.method": "GET",
    "http.scheme": "http",
    "http.target": "/",
    "http.user_agent": "curl/8.7.1",
    "http.flavor": "1.1",
    "net.transport": "ip_tcp",
    "net.host.ip": "::1",
    "net.host.port": 3000,
    "net.peer.ip": "::1",
    "net.peer.port": 54233,
    "http.status_code": 200,
    "http.status_text": "OK"
  },
  "status": { "code": 0 },
  "events": [],
  "links": []
}
This is the data, that in the following sections, we'll pipe through to Grafana Cloud for visualisation.
Create a Grafana Cloud account
To make use of this telemetry we need to get it somewhere we can visualise and make sense of it. An OTel collector helps collect the data and export to our tooling of choice. OpenTelemetry provide a Collector implementation and this is particularly useful we come to collecting telemetry in a Kubernetes cluster with the OpenTelemetry Operator. For now let's instead use Grafana Alloy, Grafana's implementation of a collector, since the collector UI helps a little with initial understanding of the flow of data and it is straightforward for Alloy to export into Grafana Cloud. This is a good place to start even if you decide to go for other alternatives later.
Sign up for a free Grafana Cloud account. Once you have an account set up, add a new stack. You should now see a dashboard for the stack.
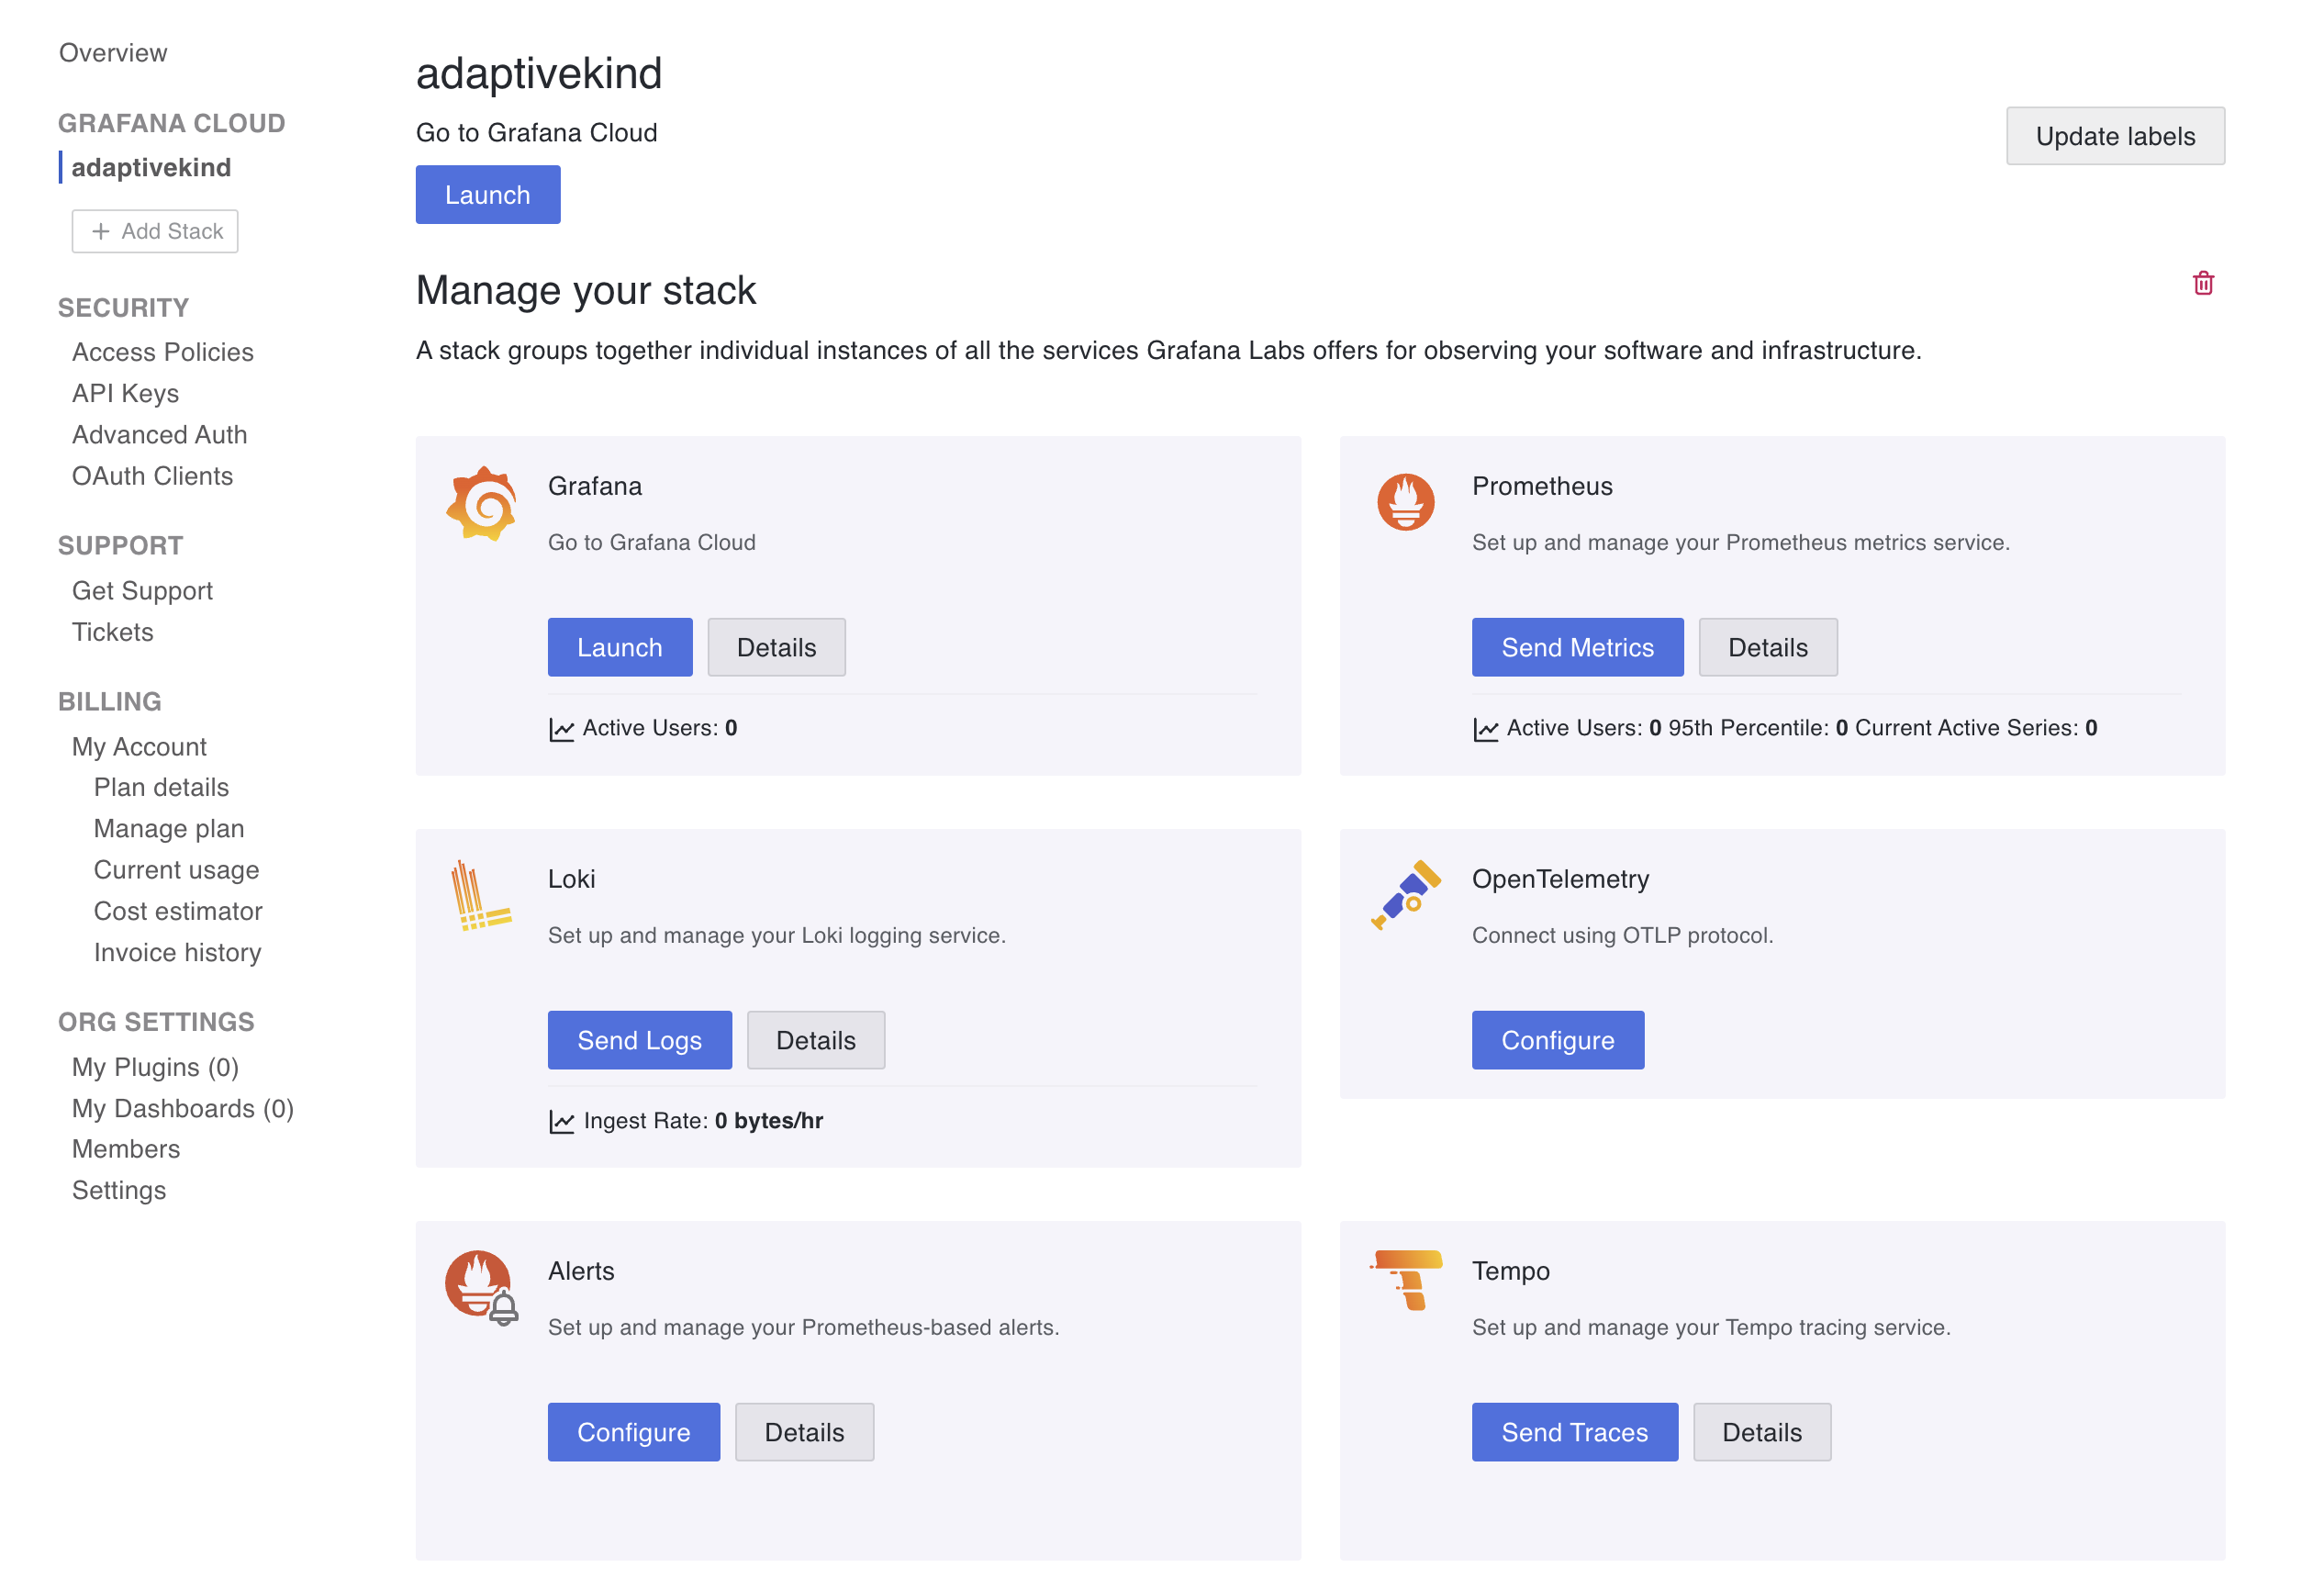
Create an access policy which we'll use for OTLP access by clicking on security -> access policies. Select your new stack name in the Realm field. Then select write for metrics, logs, and traces under scopes.
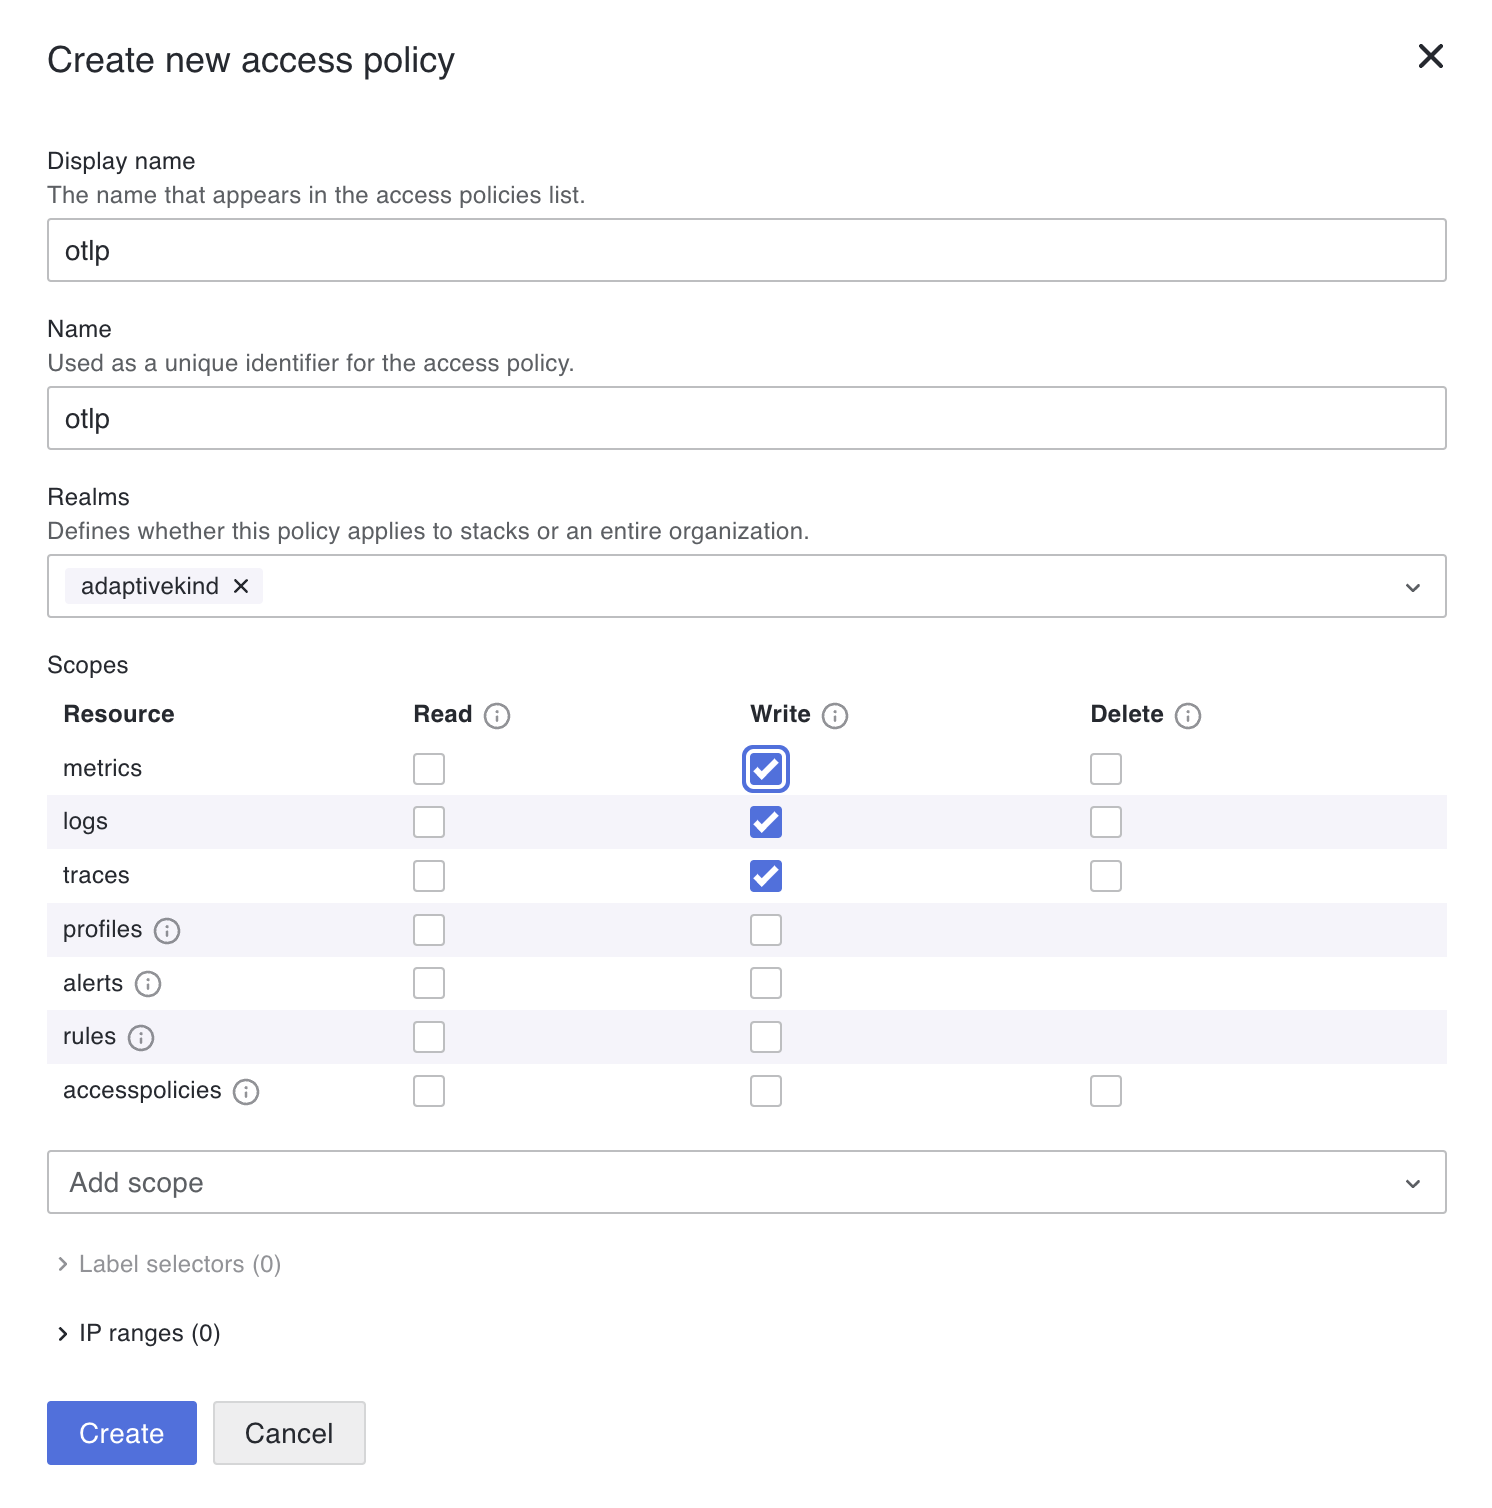
Add token for this access policy and copy the token somewhere safe. You'll need it in the steps below and you won't be able to access it again after this step from the Grafana portal.
Go back to the stack dashboard in the Grafana portal and click on Configure on the OpenTelemetry tile. Note down the Instance ID and the URL for the OTLP endpoint. You'll also need these in the steps below.
Set up the Alloy OTel collector
Create an Alloy configuration file locally.
// config.alloy
logging {
  level  = "info"
  format = "logfmt"
}
// See live data going through the pipe in the Alloy UI
livedebugging {
  enabled = true
}
otelcol.receiver.otlp "basic" {
  http { }

  output {
    metrics = [otelcol.processor.batch.basic.input]
    logs    = [otelcol.processor.batch.basic.input]
    traces  = [otelcol.processor.batch.basic.input]
  }
}

otelcol.processor.batch "basic" {
  output {
    metrics = [otelcol.exporter.otlphttp.default.input]
    logs    = [otelcol.exporter.otlphttp.default.input]
    traces  = [otelcol.exporter.otlphttp.default.input]
  }
}

otelcol.auth.basic "default" {
  username = "<YOUR_GRAFANA_CLOUD_INSTANCE ID>"
  password = "<ACCESS_POLICY_TOKEN>"
}

otelcol.exporter.otlphttp "default" {
  client {
    endpoint = "<OTLP_ENDPOINT_URL>"
    auth     = otelcol.auth.basic.default.handler
  }
}
Set the Account ID, API token and URL for the OTLP endpoint that you got from the access policy token and the OpenTelemetry configuration in previous steps above.
Start up Alloy in Docker. I've set the argument --stability.level=experimental so that we can use the livedebugging option that has been set in the configuration file above. You'll see why that is useful shortly.
docker run \
  -v ./config.alloy:/etc/alloy/config.alloy \
  -p 12345:12345 \
  -p 4318:4318 \
  grafana/alloy:latest \
    run --server.http.listen-addr=0.0.0.0:12345 --storage.path=/var/lib/alloy/data \
    --stability.level=experimental \
    /etc/alloy/config.alloy
Update OTel options to export to Alloy
We can change the OTEL_TRACES_EXPORTER environment variable to otlp to export the traces via OTLP (OpenTelemetry Protocol). By default this will use port 4318 on localhost, which is being served locally by the Alloy in Docker container we started above. We'll also add resource detectors to annotate the trace telemetry with host meta data so it easier to see the source of the metrics when we come to visualisation of the data.
OTEL_TRACES_EXPORTER="otlp" \
OTEL_SERVICE_NAME="basic-api" \
OTEL_NODE_RESOURCE_DETECTORS="env,host,os" \
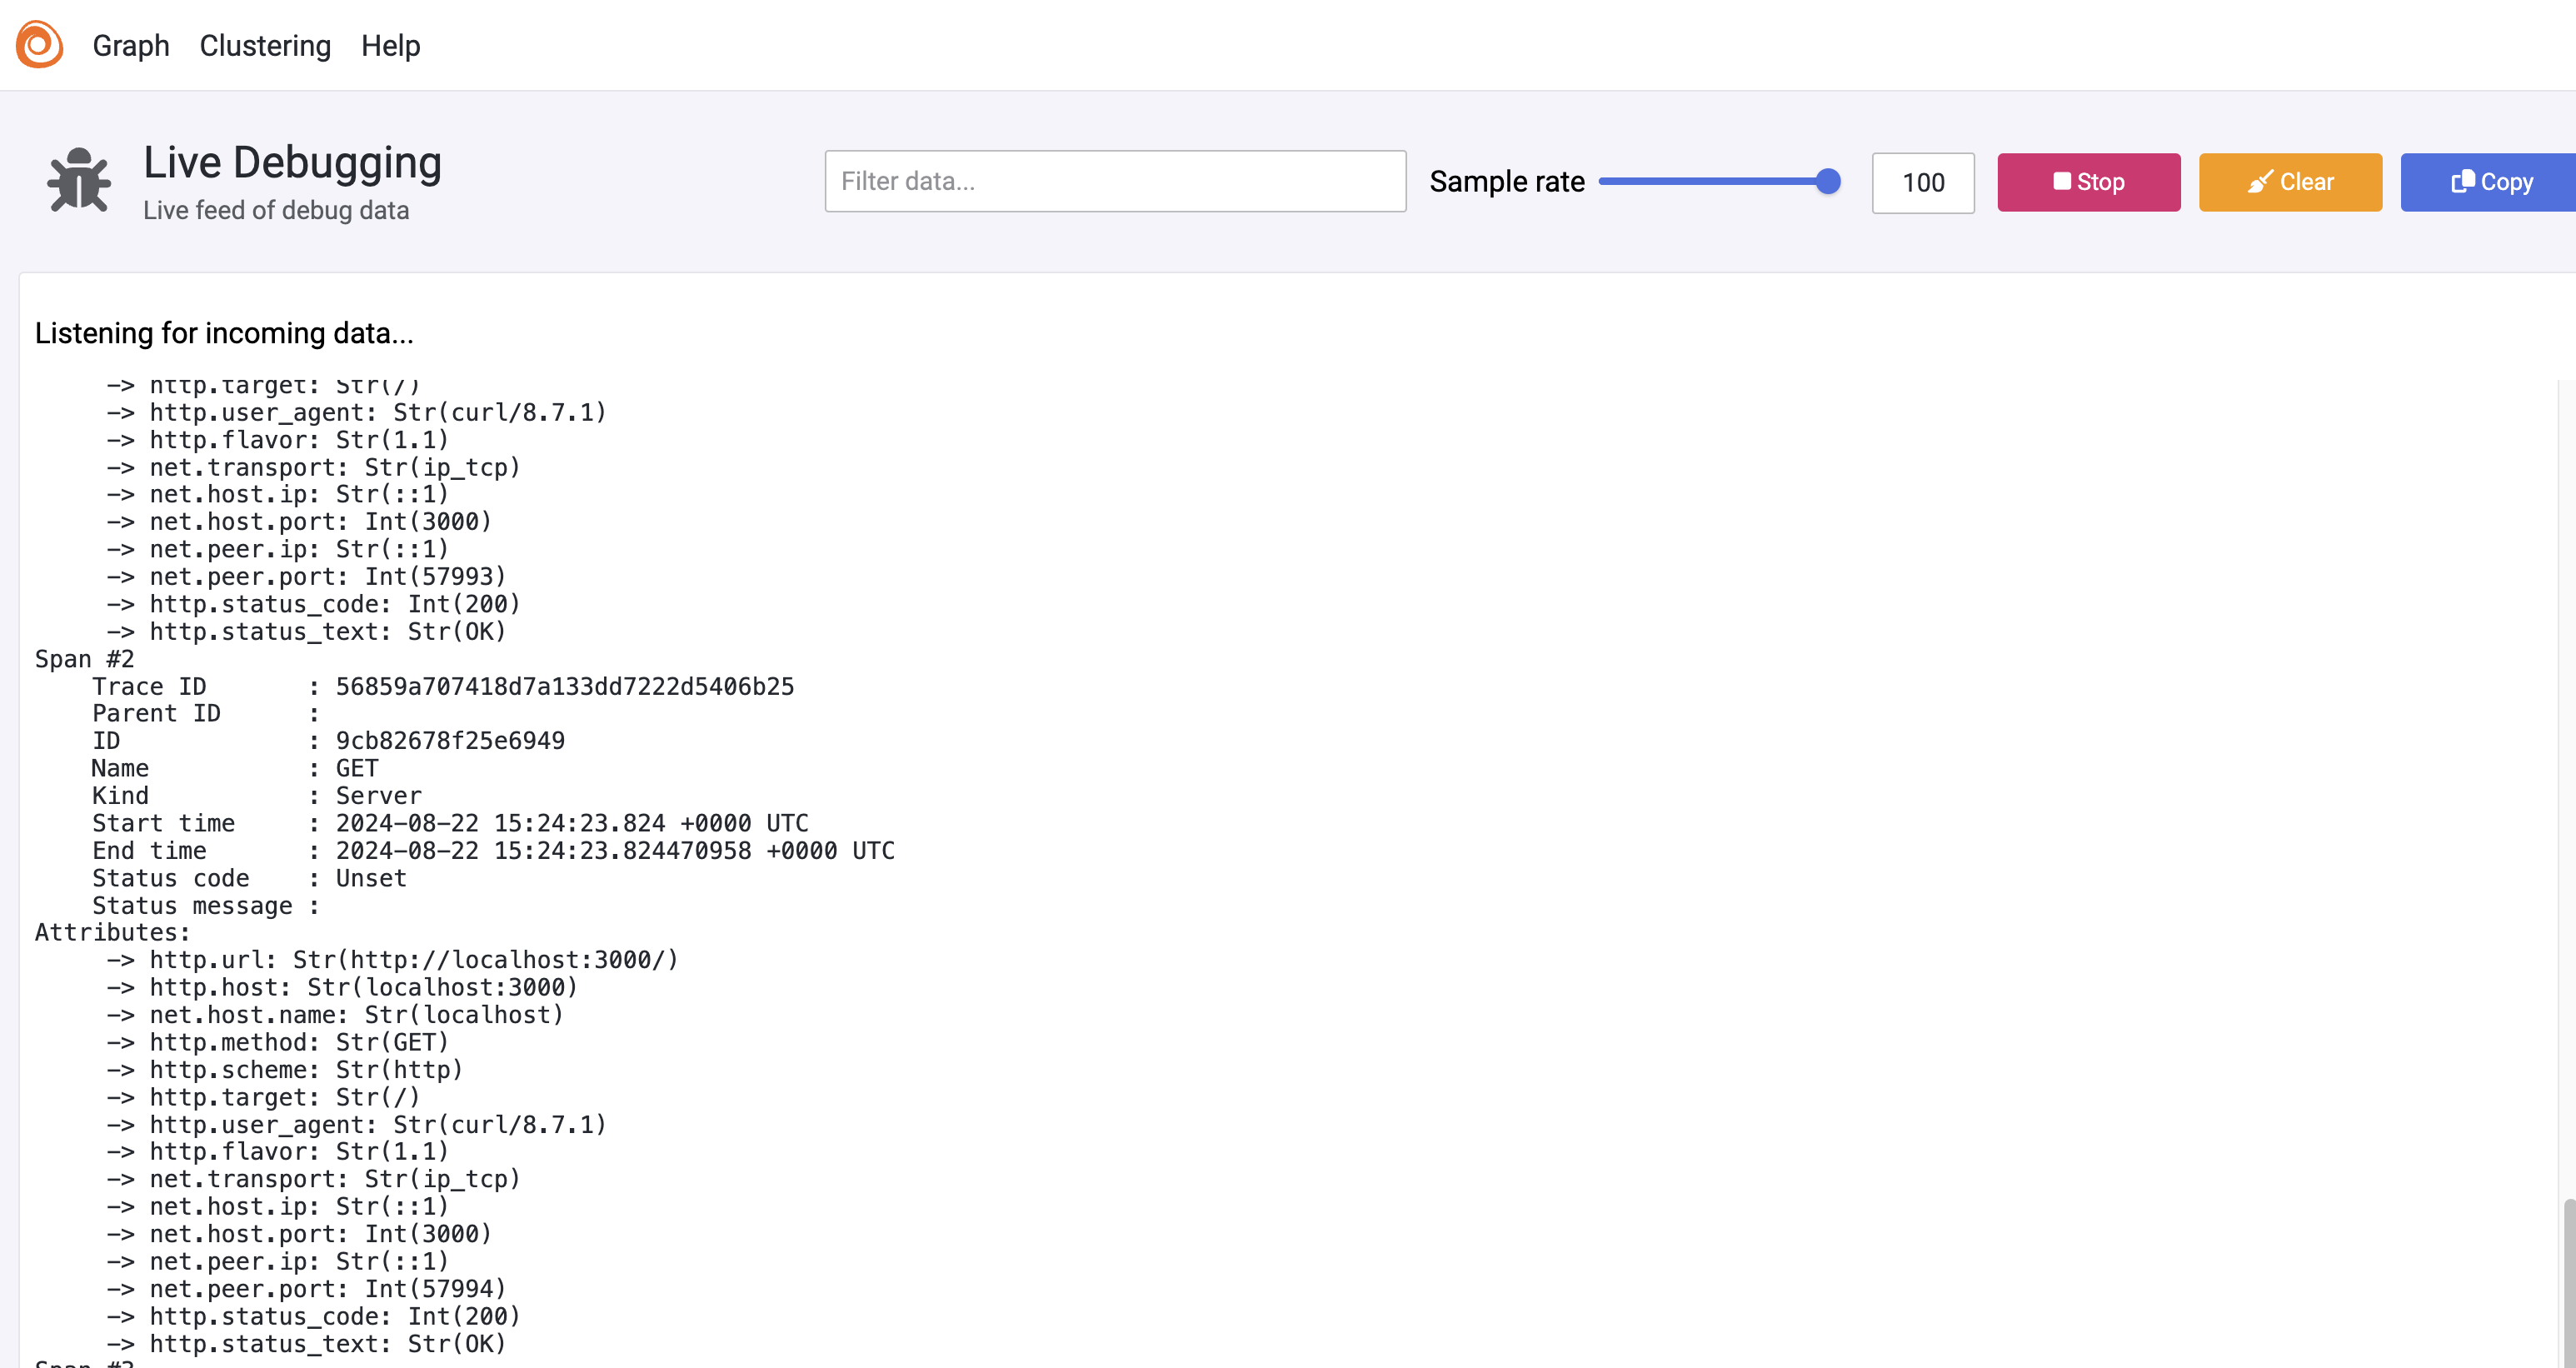
node --require @opentelemetry/auto-instrumentations-node/register index.jsThis is a good time to access the local Alloy UI at http://localhost:12345/.
Click on Graph in the menu bar, select the tile otelcol.receiver.otlp.basic and click on
Live debugging. Now Access the API with curl http://localhost:3000 a few times to give us some
data. You should see some data coming down the pipe and (if you don't see any
other errors in the Alloy logs) the trace information should be on its way
to Grafana Cloud. If you do see some errors, then you may need to check the
credentials and endpoint URL you set in the alloy.config above.
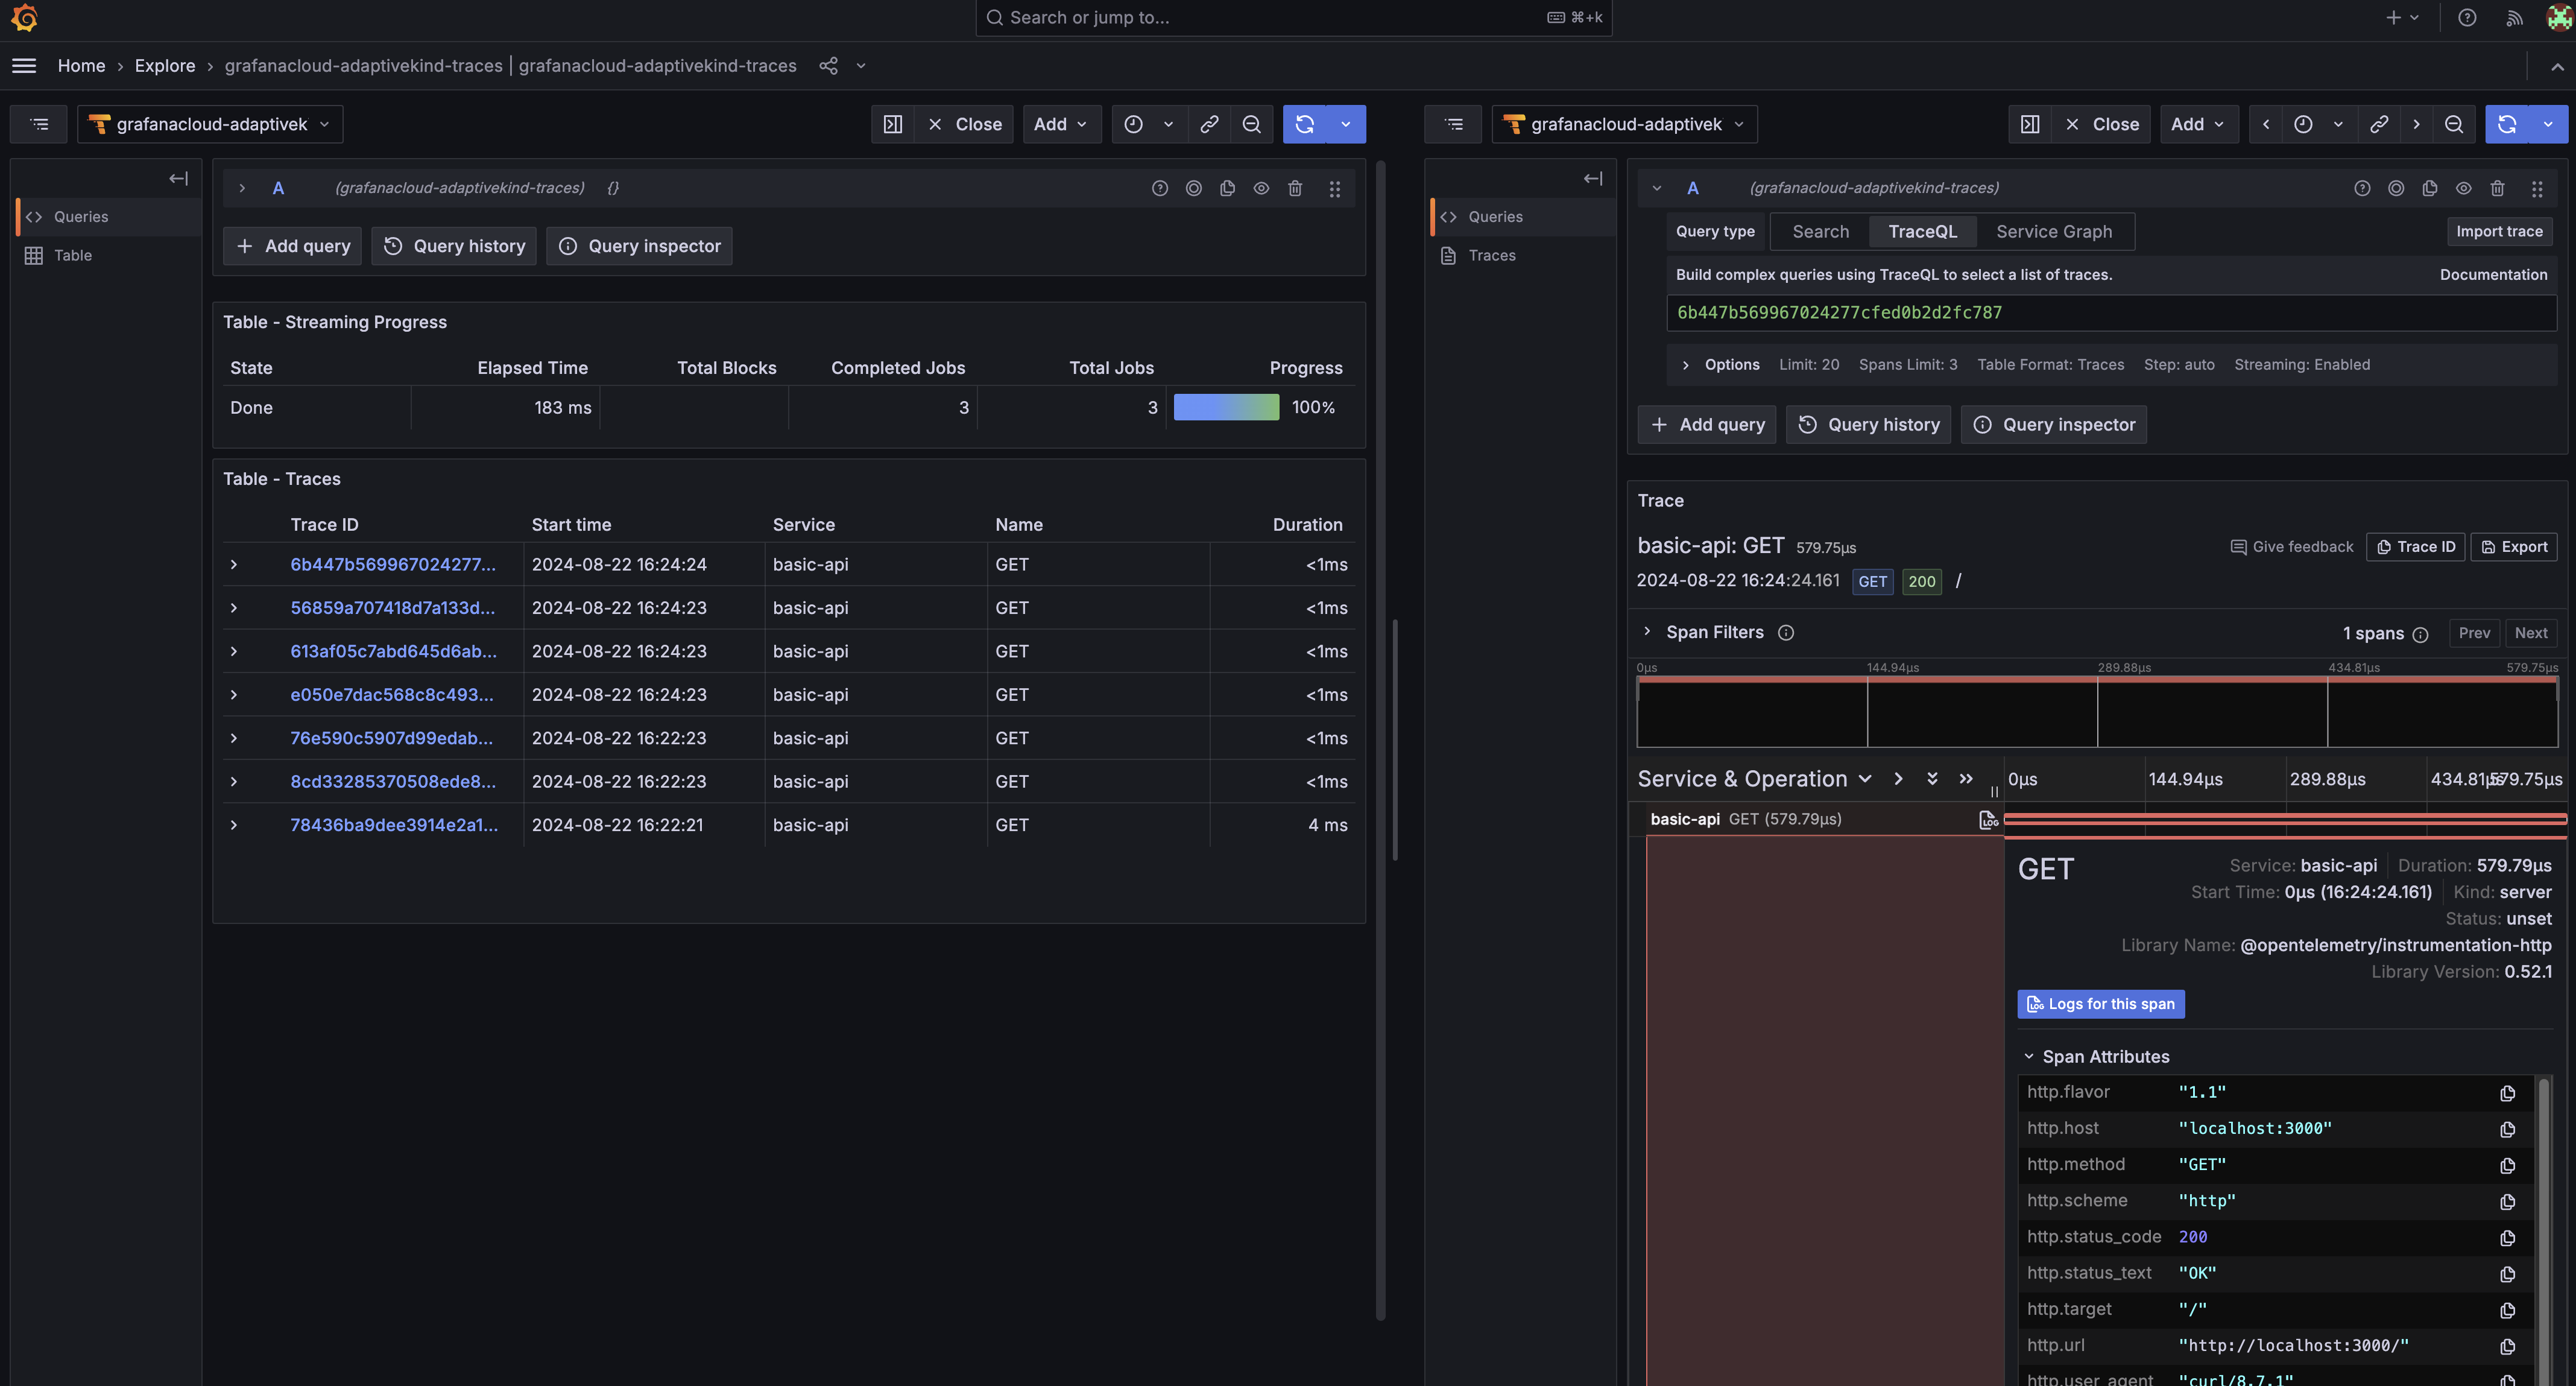
Back in the Grafana portal, launch your Grafana Cloud stack you set up earlier. Click through to Explore and select the Tempo data source. For my stack this is called grafanacloud-adaptivekind-traces. Click on Search and you should be able to see the traces that have been sent through from your local application.
Not much data yet, but we now have confidence that the telemetry is coming through.
Add Metrics
If you followed these steps yourself and navigated around the Grafana dashboard, you may have wondered why no metrics were not coming through. The auto instrumentation does capture metrics for the HTTP traffic, however metrics aren't be exported to the collector.
Auto Instrumentation documentation states. "Currently, only Traces are supported for environment variable configuration. See the open issues for Metrics and Logs to learn more."
It seems this support is in the wings, but for now we can export the metric data by explicitly configuring it in alternative instrumentation code.
We'll need the @opentelemetry/exporter-metrics-otlp-http package, so install that first.
npm install --save @opentelemetry/exporter-metrics-otlp-httpThen create a file called instrumentation.js with the following code where we explicitly export the metrics periodically.
// instrumentation.js
const { NodeSDK } = require("@opentelemetry/sdk-node");
const {
  getNodeAutoInstrumentations,
} = require("@opentelemetry/auto-instrumentations-node");
const { PeriodicExportingMetricReader } = require("@opentelemetry/sdk-metrics");
const {
  OTLPMetricExporter,
} = require("@opentelemetry/exporter-metrics-otlp-http");

const sdk = new NodeSDK({
  metricReader: new PeriodicExportingMetricReader({
    exporter: new OTLPMetricExporter(),
  }),
  instrumentations: [getNodeAutoInstrumentations()],
});

sdk.start();
Start up the API, requiring this instrumentation code instead of the auto-instrumentations-node from before.
OTEL_TRACES_EXPORTER="otlp" \
OTEL_SERVICE_NAME="basic-api" \
OTEL_NODE_RESOURCE_DETECTORS="env,host,os" \
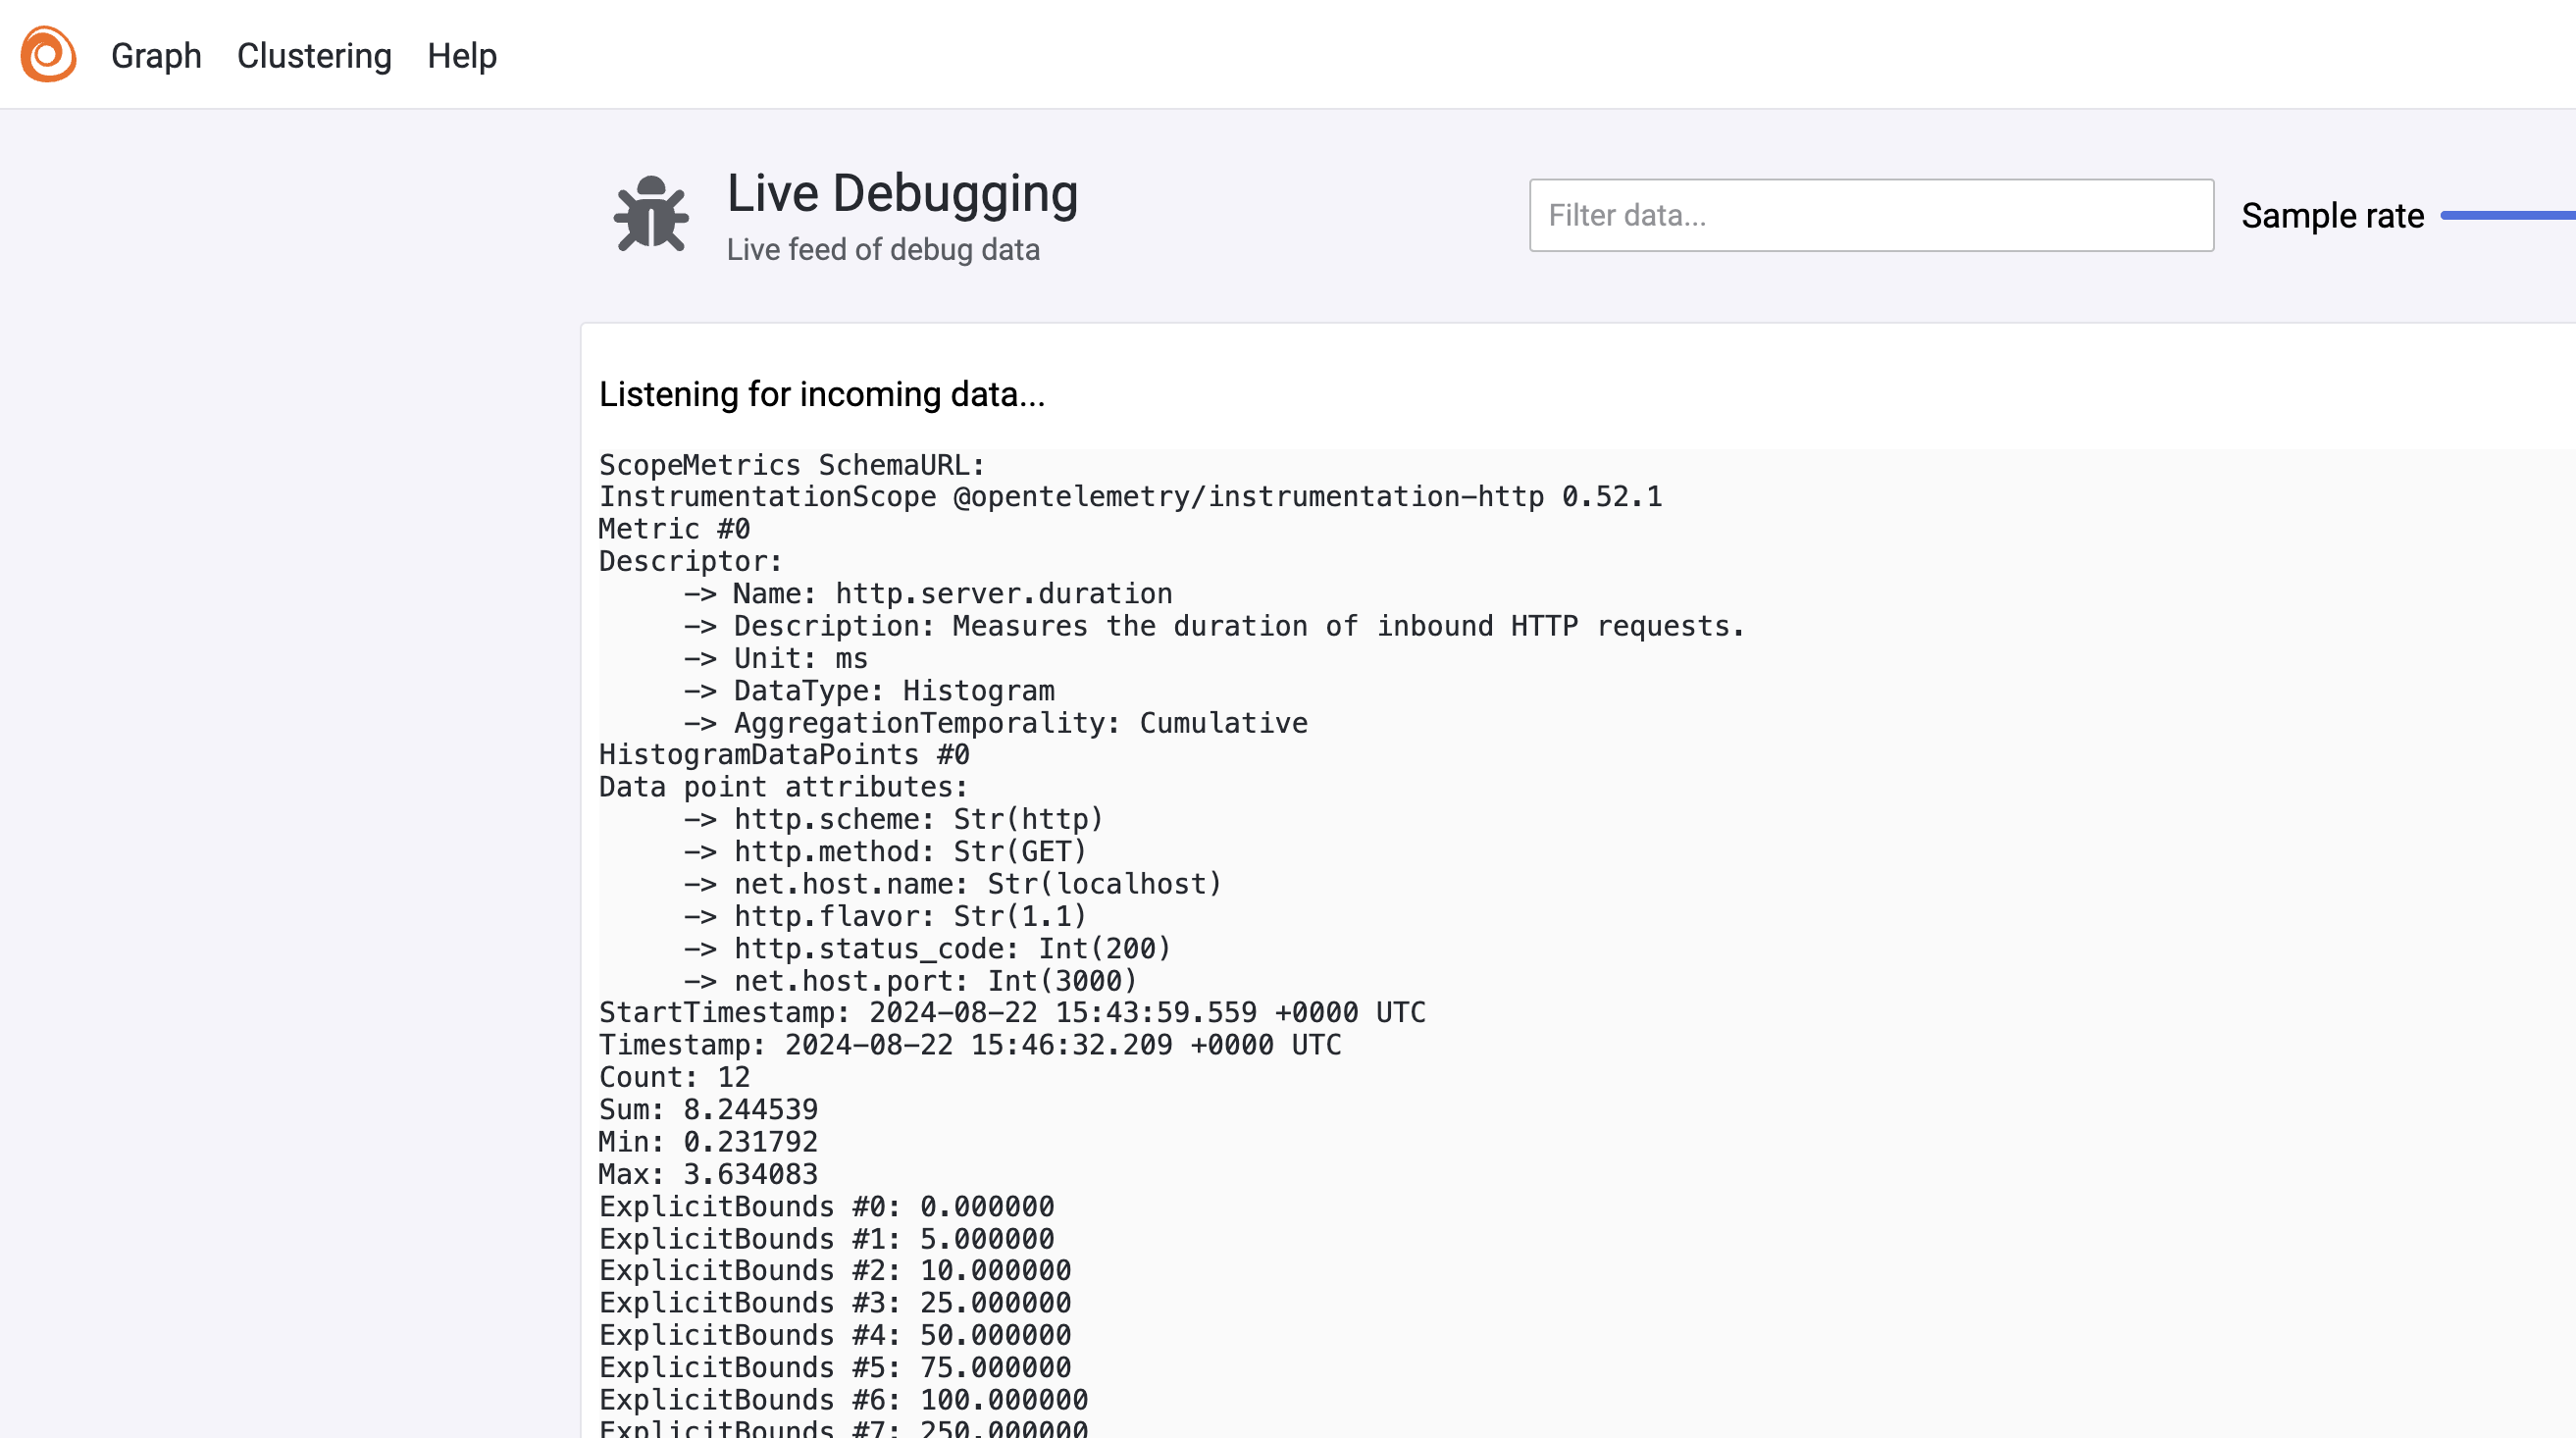
node --require ./instrumentation.js index.jsHit our API curl http://localhost:3000 a few more times. In the Alloy UI we
should now see metrics being collected every 60 seconds. Wait for a short while
to see these, e.g.
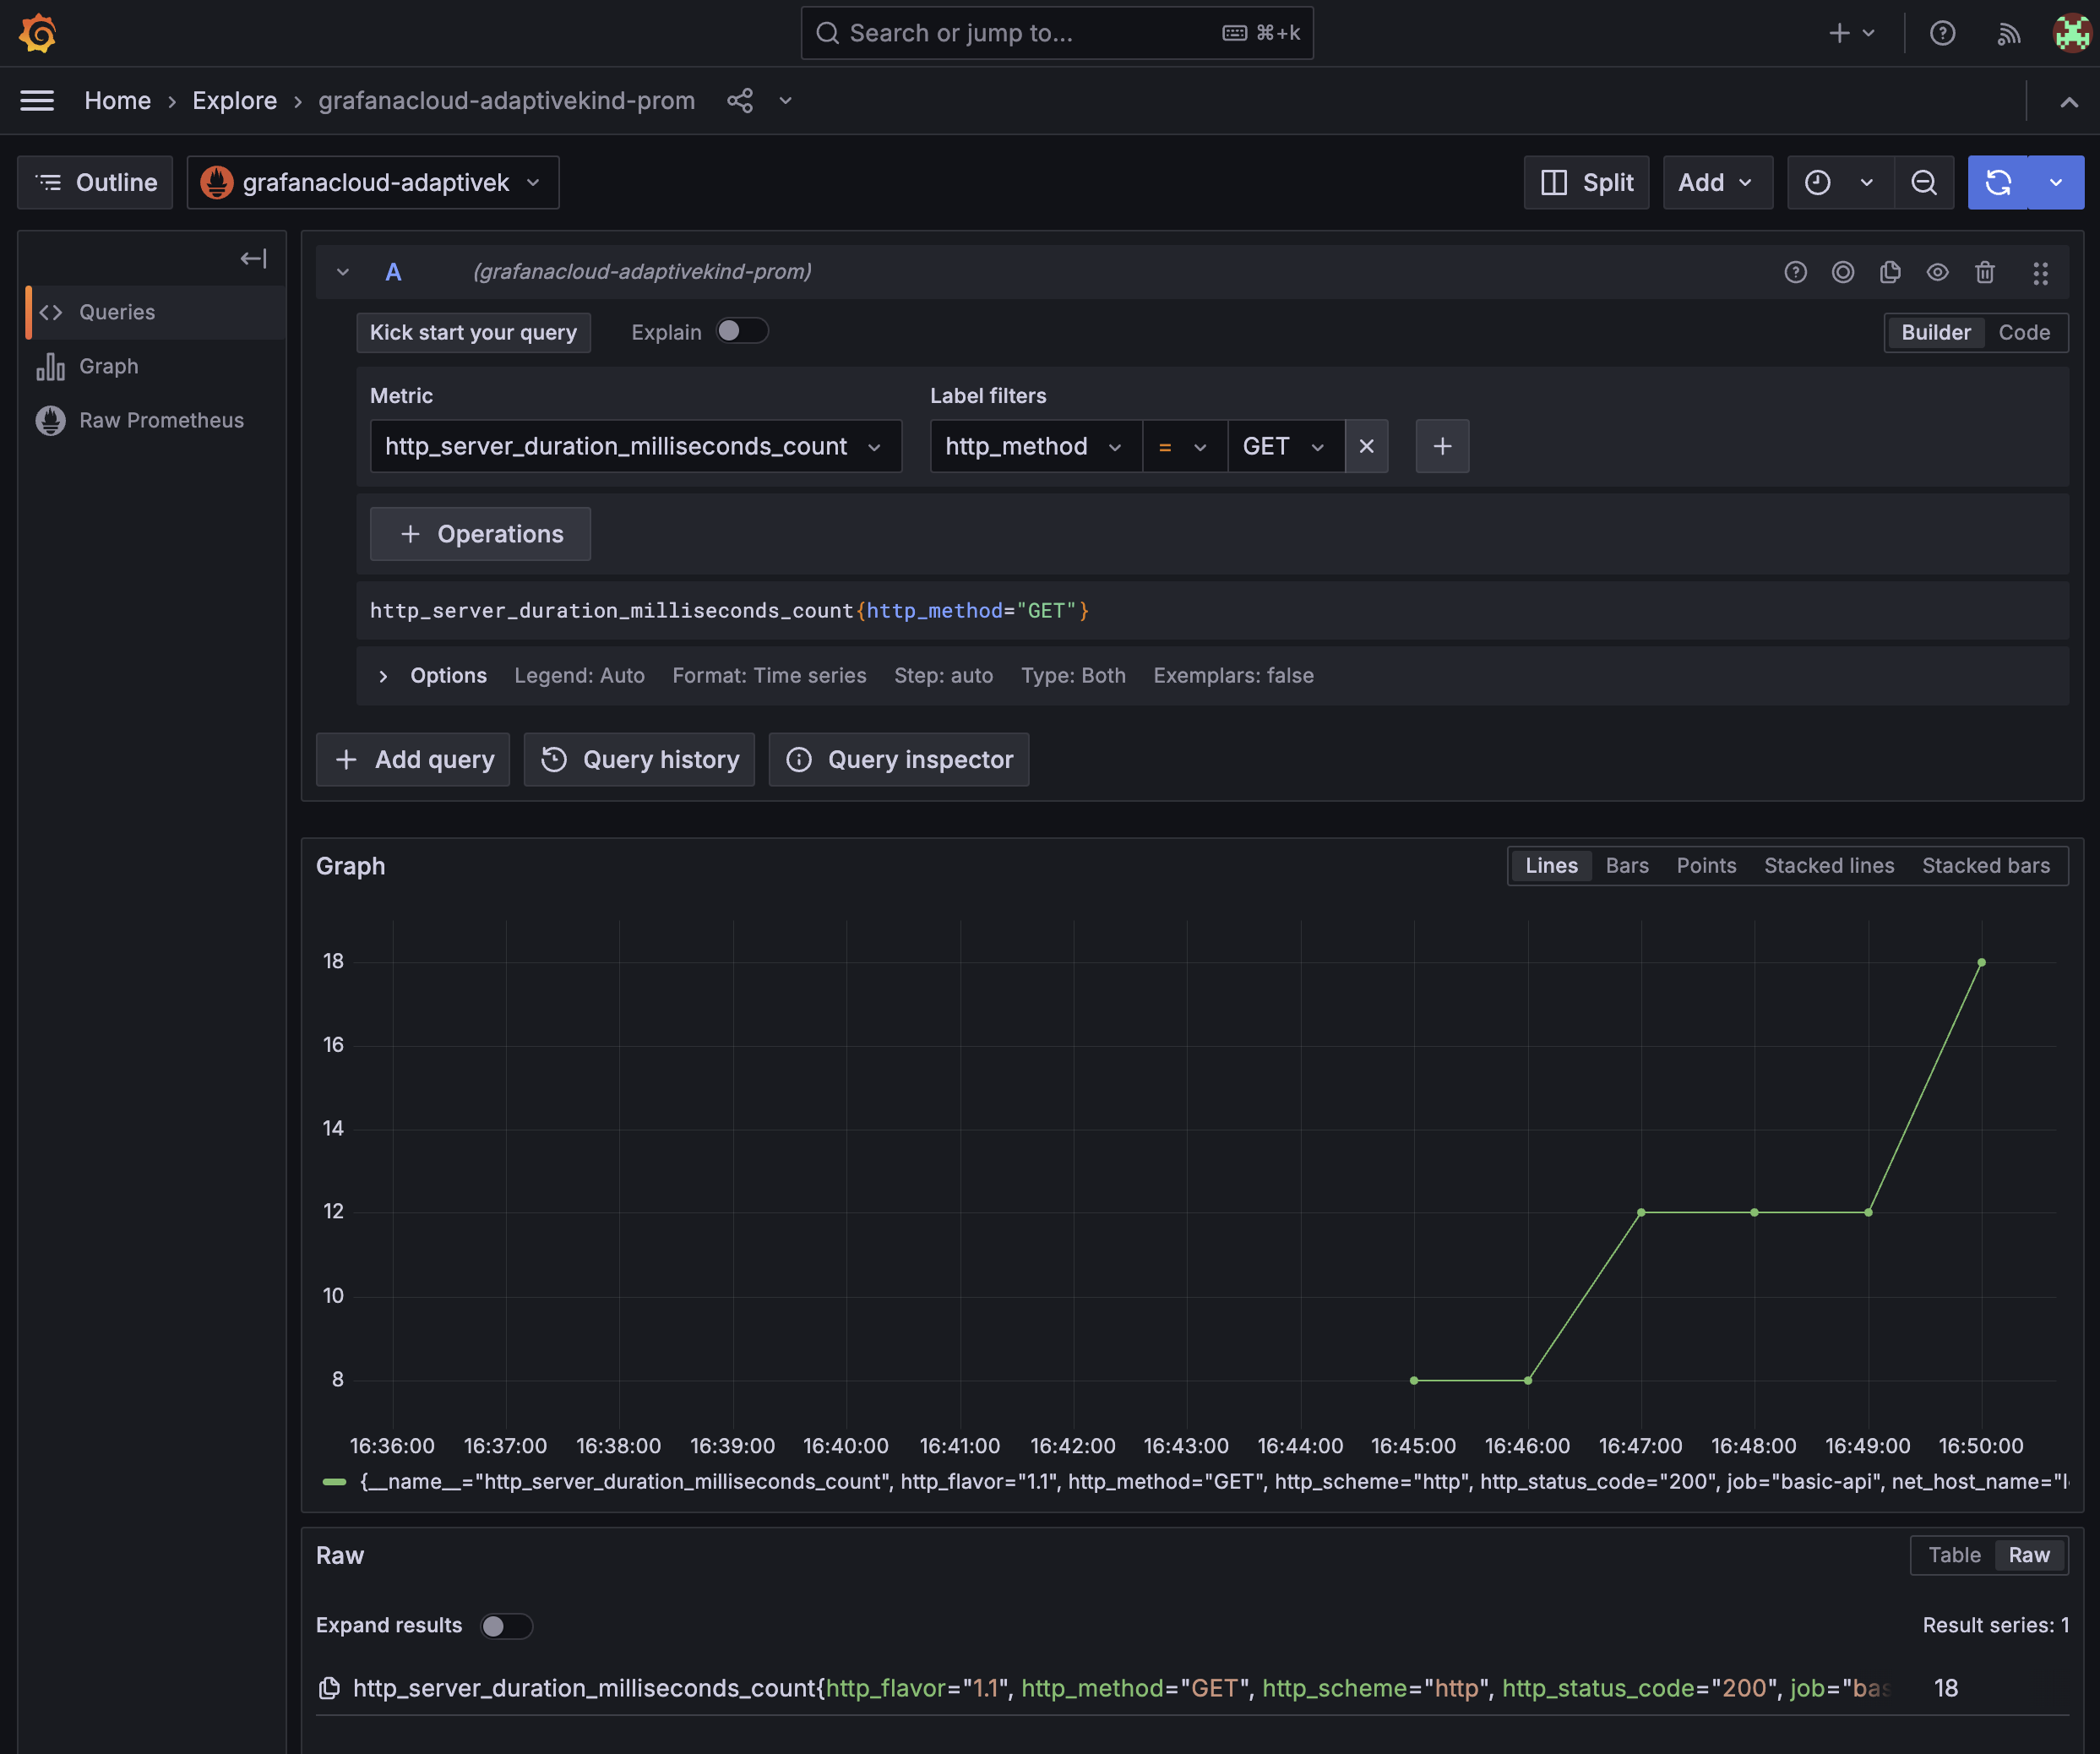
Now visit your Grafana stack dashboard. Go again to Explore in the dashboard, but this time select the Prometheus data source. You should be able to see the metrics coming through, for example count of GET requests coming through.
Enable Application Metrics in Grafana
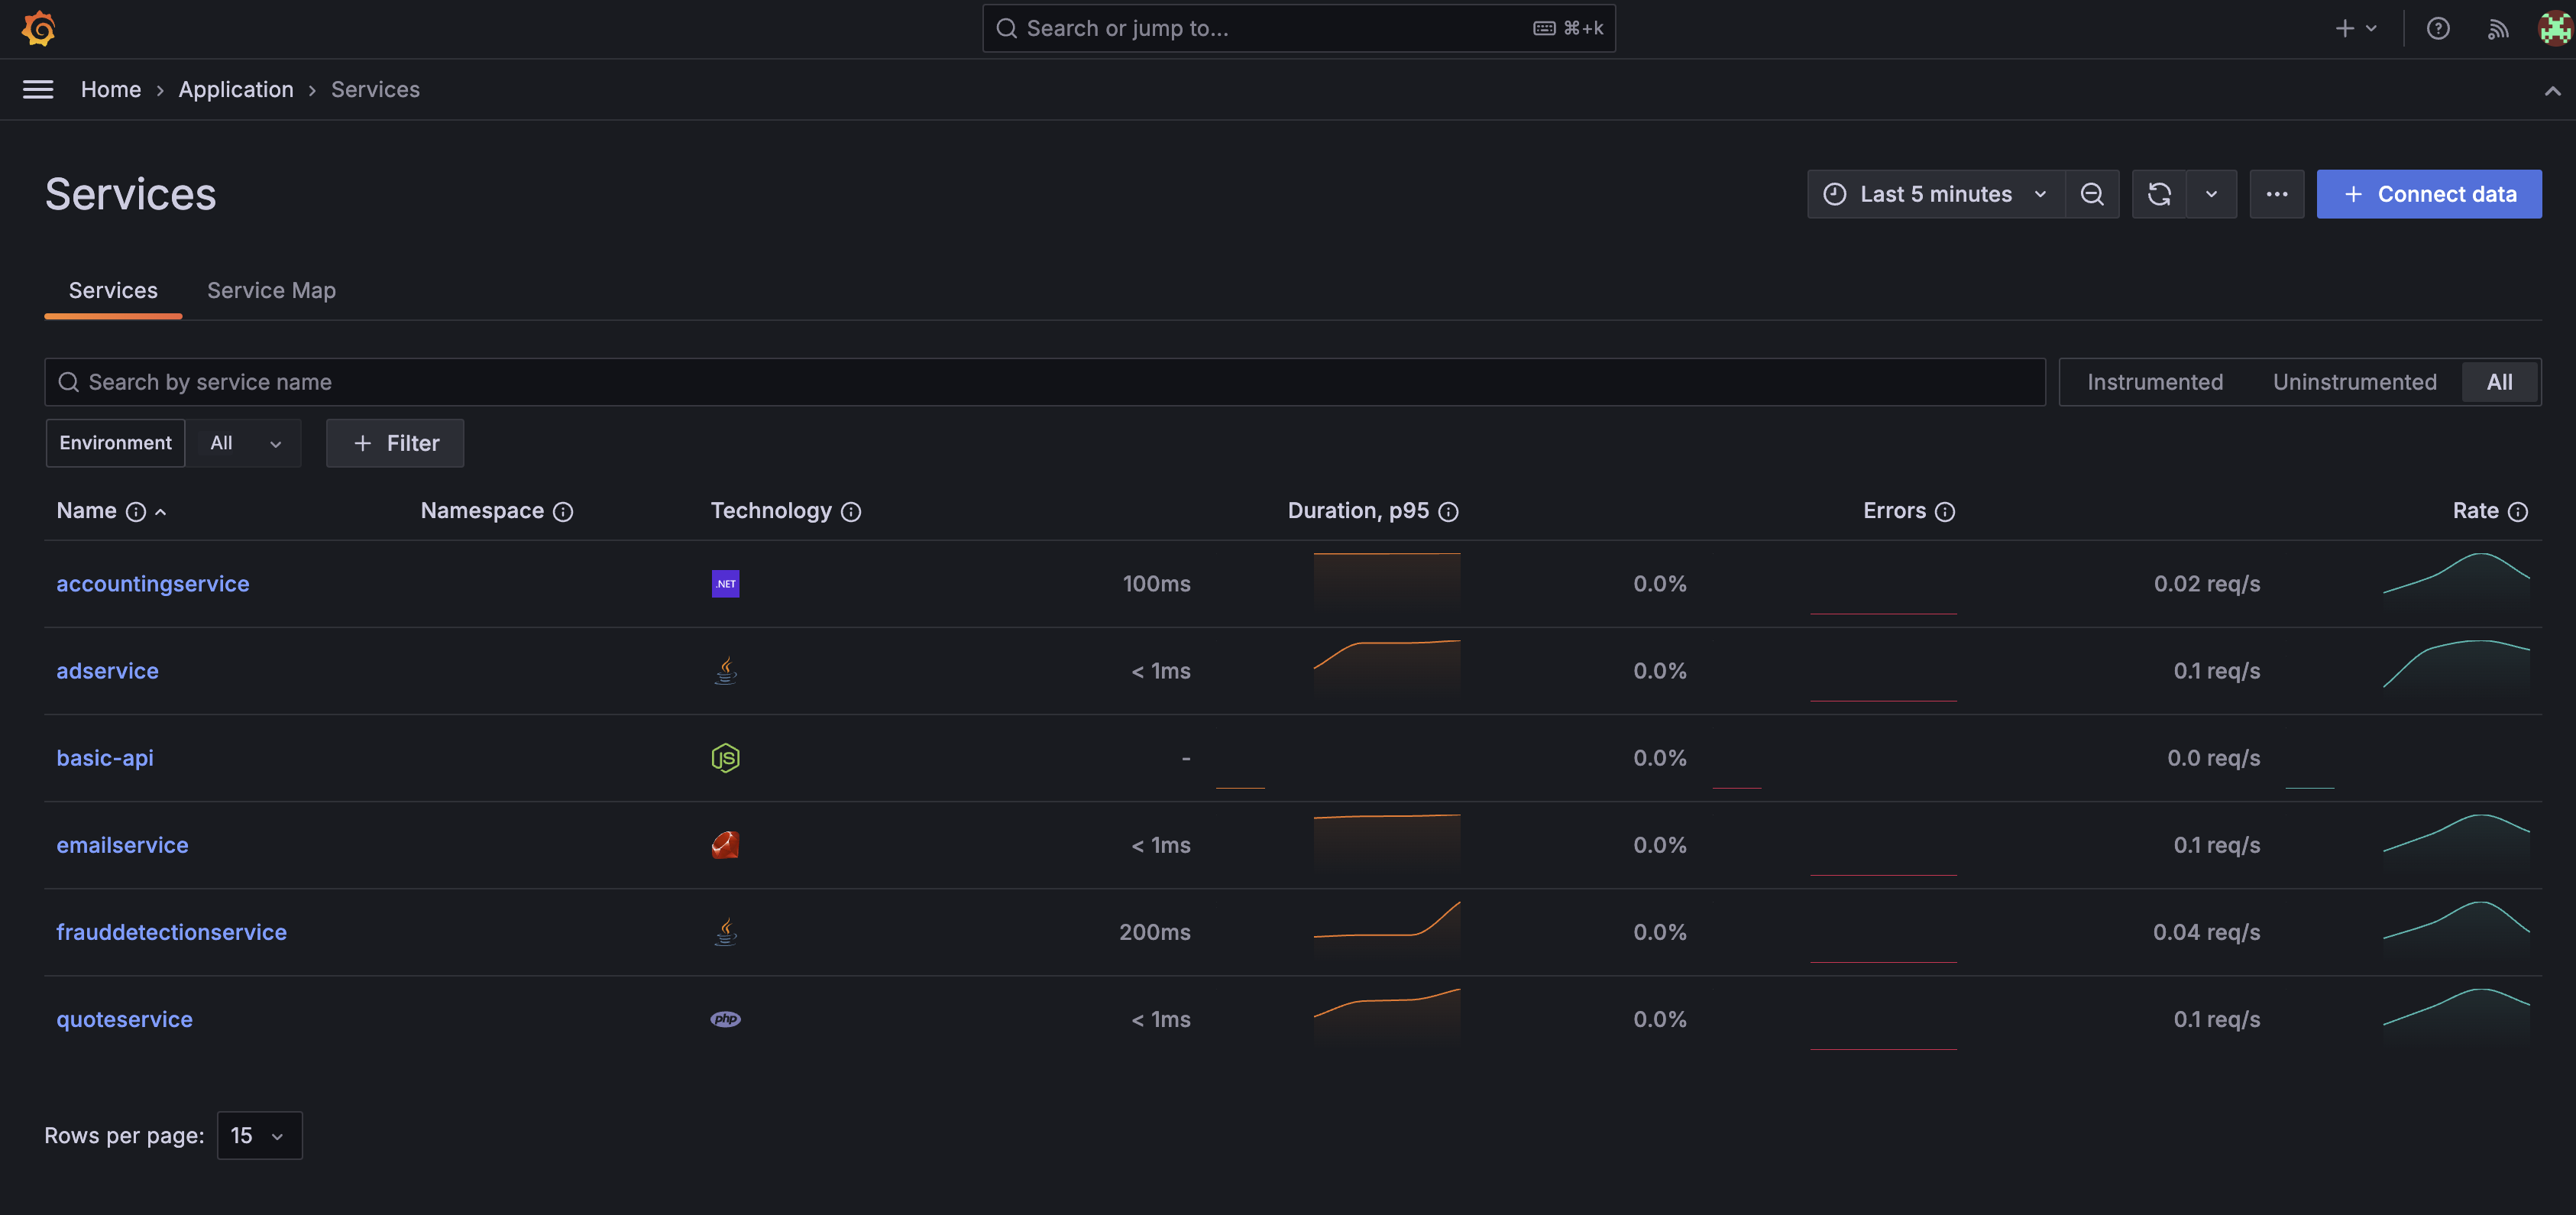
Click on Application in the Grafana dashboard and click the Enable metrics generation button. Agree to the Ts & Cs, although if you are on a free account then "There is no additional cost for Grafana Cloud Free accounts."
After 5 minutes or so the "basic-api" service should be visible and you should start see an overview of the service metrics. Not much data yet, but let's move on to the next step to load more telemetry so we can see this Application services dashboard come to life.
Run OpenTelemetry demo application
The OpenTelemetry demo application is a typical web application that will populate some telemetry. We can start this up and wire it up to the Alloy OTel collector we already have running. Note that this stack does have a component that puts load on the system. This is great to capture telemetry, but once you are finished do remember to turn it off as it will be using substantial CPU.
We set OTEL_COLLECTOR_HOST to host.docker.internal to point the telemetry from the demo to the Alloy instance we have running on localhost. Let's spin up the demo with docker compose.
git clone https://github.com/open-telemetry/opentelemetry-demo.git
cd opentelemetry-demo/
OTEL_TRACES_EXPORTER="otlp"                \
OTEL_SERVICE_NAME="otel-demo"              \
OTEL_NODE_RESOURCE_DETECTORS="env,host,os" \
OTEL_COLLECTOR_HOST=host.docker.internal   \
  docker compose up --force-recreate --remove-orphans --detach
Once that has started up you will be able to access the demo at
http://localhost:8080/, you can click around to generate some metrics, but
the load generator component is doing this hard work for you as well.
You should be able to see the metrics, traces and logs now coming into the Grafana dashboard. After a few minutes the Application service dashboard should start to populate.
It is worth exploring the data collected here if you are new to Grafana, however when you are done, stop the demo with.
docker compose downAlso stop the Alloy docker container and the local basic API process if you have that still running.
Summary
I hope you've found this fast track through OpenTelemetry interesting and seen how you can use this kind of approach to instrument your stack. I have just used Node.js here, but similar principles apply to the other languages supported by OTel.
The approach of decoupling the telemetry collection from the code of your service is powerful. It helps to separate concerns and allows you to swap in different implementations for observability and monitoring for different areas of you stack or for different environments. We can also configure the pipeline to control where telemetry is sent along with how telemetry is filtered, all without the application in question needing to be concerned.
It is also great to see that the Grafana Cloud free account has many of the features you'd see in a paid account. Access is restricted to a just a few users, but the limits seem more than adequate to experiment with Grafana.
Enjoy using the OpenTelemetry tooling, it can be an incredibly valuable for vendor neutral telemetry capture in any system you choose to build.